
In two-dimensional analytic geometry, the graph of an equation in the variables x and y is a curve in R2.
In three-dimensional analytic geometry, the graph of an equation in the variables x, y and z is a surface in R3.
Describe the surface in R3 represented by each equation.
(a) z = 3 (b) y = 5
Solution
(a). In R3 , the equation z = 3 represents the set of all points
{ (x, y, z) | x, y ε R, z = 3 }
This set contains infinitely many points.
However, each point (x, y, 3) in this set has a common property: each point lies 3 units above the xy-plane.
That is, this set of points is the horizontal plane that is parallel to the xy-plane and is 3 units above it.
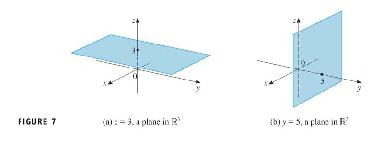
(b) Similarly, in R3 , the equation y = 5 represents the set of all points
{ (x, y, z) | x, z ε R, y = 5 }
Each point (x, 5, z) in this set lies 5 units above the xz-plane.
So this set of points is the vertical plane that is parallel to the xz-plane and is 5 units to its right.
Let k be a constant (a real number). Then
(1) The graph of the equation x = k in R3 is a plane parallel to the yz-plane;
(2) The graph of the equation y = k in R3 is a plane parallel to the xz-plane;
(3) The graph of the equation z = k in R3 is a plane parallel to the xy-plane;
YOU TRY IT
Describe the region of R3 that is represented by the inequality y > 5.
toc | return to top | previous page | next page
Content ©2011. All Rights Reserved.
Date last modified: January 19, 2011.
Created with SoftChalk LessonBuilder
![]()