A SURVEY OF NO (OR LOW) COST STATISTICAL
SOFTWARE PACKAGES
FOR BUSINESS STATISTICS
Nancy Leveille
University of Houston-Downtown
Anna Simmons
University of Houston-Downtown
Diann Resnick
University of Houston-Downtown
Ron Barnes
University of Houston-Downtown
ABSTRACT
A number of Business Statistics courses have migrated
from using SAS, SPSS or Minitab to less expensive statistical software. Excel,
even with its Data Analysis and Charts options has proved inadequate for most
courses. While Excel Add-On packages are now often provided by publishers with
statistics textbooks, many faculty members find them lacking in breadth or
depth for all the usual topics covered. This paper surveys various alternative
sources of statistical software packages available at nominal, or no, cost that
address these shortcomings. A number of web based software packages including StatCrunch.
StatPages and CrunchIt! are
considered. In addition, a number of web pages where one can perform
statistical calculations including MyStat, Statcato, ActivStats and R are
noted. Teaching applets and resources are also mentioned. Some of these sources
are tied to publishers and are available in student versions either free or at
low cost. Others are stand-alone and available at low or no cost. These
alternative statistical packages are available for faculty to use in their
research.
INTRODUCTION
While SAS, SPSS and Minitab have seemed essential for
statistical investigations, escalating costs and budget cuts have forced many
university programs to actively seek out viable, less expensive replacements.
Business Statistics courses, when taught correctly, involve a significant
amount of statistical software generated results. Since Excel is widely used in
business, the first replacement attempts focused on Excel and, in particular,
its data Analysis and Charts options. The Byzantine procedures one must
navigate to get to anything resembling, but not completely, a correct frequency
histogram from either of these Excel options, suggests to students that “an
elephant is being used to crack a peanut!” The Data Analysis option contains
procedures on hypothesis testing, ANOVA and simple regression among other
topics. However, these procedures are inadequate. For example, the regression
procedure only allows for a single independent variable. Similarly, the One Way
ANOVA only produces the ANOVA table with F and p-values. If these indicate
differences, because no comparison tests are included, it is not possible to
determine which particular means are significantly different. The ANOVA
procedure also lacks any of the usual tests for the assumption of equal
variances. Students can conclude significant differences occur, based on the
procedure’s output, without realizing that one of the assumptions underlying
the validity of the test is violated! Multiple Regression is not available.
Further, Time Series, Quality Control, and a variety of other statistics topics
are either not covered or given inadequate procedures in Excel.
To remedy the deficiencies in Excel (Cryer, 2001), a number of publishers have produced
Statistical Add-On routines which overlay the Excel package. Disk versions are
packaged with various statistics textbooks while others use downloads.
Virtually all publishers of Business Statistics textbooks have a package of
such Add-On routines. However, the quality and extent of these various packages
varies widely – from user friendly to user hostile and from adequate to
trivial. While many publishers allow colleges adopting their texts to load these
packages in their Statistics Labs and also on classroom computers, in the
future, the students will neither have access to newer editions of these
packages nor any support services after they graduate. Therefore, the software
needed in their jobs and in statistical investigations will probably be soon outdated
or unavailable. To address these additional difficulties, Business Statistics faculty
and researchers have sought out viable and adequate alternatives. This has led
to the consideration of low, or no cost, software packages that are widely
available, statistically correct, comprehensive and likely to continue in
existence for a long time into the future. It is these alternative packages
that are the focus of this paper.
WEB-BASED
STATISTICAL SOFTWARE
StatCrunch
StatCrunch (Pearson, 2010) is a web-based data
analysis tool designed for teaching statistics. It allows users to perform
complex analyses, share data sets and generate reports. It provides users with
an extensive list of statistical operations. A suite of graphical
representations allows users to generate visual reports of their findings.
Figure 1a. is a sample of a StatCrunch histogram. The
histograms featured below use the listed data for years doctorate earned by
faculty members: 1965, 1972, 1982, 1993, 2004, 2001, 2009, 1997, 2004, 1995,
2006, 2006, 2005, 1997, 1976, 2004, 1973, 2004, 1969, 1997, 1986, 1986, 1984,
1989, 2000, 1990, 1999, 2004, 1996. StatCrunch is straightforward, intuitive, and easy to use.
The highlighted column had the corresponding data highlighted in the table
which is a good feature for teachers. Figure 1 b. is a histogram generated by CrunchIt! which will be discussed below.
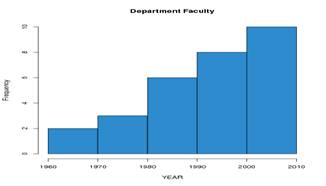
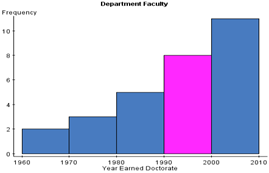 Figure 1 a.
StatCrunch Sample Figure
1 b. CrunchIt! Sample
Figure 1 a.
StatCrunch Sample Figure
1 b. CrunchIt! Sample
StatCrunch’s recently added features include: Tukey’s
HSD test for multiple comparisons of ANOVA; logistic regression, nonparametric
procedures; regression diagnostics; various probability distributions and
Google maps software for geographical displays. StatCrunch has an extensive
listing of Data Menu procedures, an extensive Graphics, Menu and a Stat Menu
that includes: summary statistics, contingency tables, Z and t statistics,
ANOVA, nonparametrics, simple and multiple linear regression and logistic
regression, and all the usual quality control charts. StatCrunch is now
exclusively distributed by Pearson Education so faculty will be required to
create a Pearson Educator account if they do not already have one. Instructors
are offered complementary access to StatCrunch. Go to
their website at www.statcrunch.com , click on live link Subscribe, click on live link for request access to obtain an access code,
then click on the redeem access code.
Your campus Pearson representative can also assist you. Students have three
options: (1) redeem access code which provides for a 10 day free trial, (2)
purchase 6 months of access for $12, or (3) purchase 12 months of access for
$22.50. Professionals can also choose either of these last two options. More
importantly, one can purchase a bulk number of StatCrunch access codes. When a
12 month StatCrunch access code is bundled with a Pearson textbook as a value
pack, the additional charge for StatCrunch is only $5. A very helpful Study
Card is available from Pearson and is intended to serve as a brief introduction
to the use of StatCrunch and covers the procedures most students will encounter
in an introductory Statistics course. There are help links on the web site with
more extensive documentation.
CrunchIt!
CrunchIt! 2.0. (2010) is a free, no frills, statistics
website that is also straightforward, intuitive and easy to use. The main
categories are Data, Statistics, and Graphics with each of these live links featured
on the main page, at http://crunchit2.bfwpub.com/crunchit2/ips5e/?section_id , leading to many choices. Figure 1b. shows a sample histogram made through
the Graphics link for comparison with the StatCrunch version. Note two
differences: (1) the label Frequency is indicated along the vertical axis in
the CrunchIt! version and (2) the StatCrunch version has the added feature of
highlighting data in a table corresponding to a column highlighted by clicking
on it.
StatPages
StatPages (Pezzullo, 2010) lists a
collection of websites for performing statistical calculation available at http://statpages.org/javasta2.html#Freebies . Sections of the website include: (1) Interactive
Stats, (2) Free Software, (3) Books and Manuals and (4) Demos and Tutorials. We
leave exploration of the site to the interested reader with the caveats that
some of the programs take a long time to download, some links lead to
advertisements and some sites have errors. For example, at one link called Statext what was called a histogram was neither a histogram
nor importable into this document and so the sample is not included with the
others above.
DOWNLOADABLE PROGRAMS
ActivStats 3.0
ActivStats 3.0 (Velleman, 2010) is a
multimedia education product on CD-ROM for teaching introductory college-level
statistics and using the Data Desk data exploration package. The Academic
Version can be used along with an introductory statistics course or for
additional study and review. It is designed to work with many standard
statistics texts and can even be used as the main text of a course. As such, it
provides a built-in statistics package at no extra cost. To purchase the
Academic Version, one must be a student or faculty member affiliated with an
accredited academic institution. ActivStats Academic
Version is sold through http://www.mypearsonstore,com and supported by Pearson Education.
MyStat
The MyStat package (Systat, 2008), www.systat.com/MystatProducts.aspx , essentially links to a student version of Systat. This is a competitor to SPSS, SAS, Minitab, JMP,
Data Desk and similar packages. It is more powerful than the student versions
of any of these and the price is right – free. It is easy to use and more like
Windows applications than R which is discussed below.
R
R (Institute for Statistics and Mathematics, 2010) is
a programming language for advanced statistics and as such it is not
particularly easy to use. It is available at http://www.r-project.org/main.shtml Teachers ask
about it because they have heard that it is free. That is true, but is not the
only factor to be considered. It is appropriate for use by individual students
who are programmers or planning careers where high powered statistics is
required. The graphical user interfaces, such as R Commander, make R a bit more
user friendly.
Statcato
Statcato (Object Refinery Limited, 2009) is statistics
software, available at www.statcato.org . It is a free Java software application developed for elementary
statistics applications. It is tailored for community college students and
instructors.
TEACHING APPLETS
Resources on
the Web for Statistics Students and Teachers
The Resources on the Web for Statistics Students and
Teachers (Heckard and Utts,
2010) has the following categories: Current News, Resources by Teachers for
Teachers, Survey Methodology, Data Sets, Gateways to Data and Government
Reports, Miscellaneous, Java and JavaScript Activities, Listserve
Archives, Journal of Statistics Education, Quotes, and Jokes. The fun of
exploration is left to the interested reader.
Rice Virtual
Lab in Statistics
David Lane at Rice University has developed the Rice
Virtual Lab in Statistics (Lane, 2008) which is available for free at http://www.ruf.rice.edu/%7Elane/rvls.html The main listed links are: HyperStatOnline,
Online Statistics: An Interactive Multimedia Course of Study,
Simulations/Demonstrations, Case Studies, and Analysis Lab.
SUMMARY
This paper noted that escalating costs and increasing
budget cuts are forcing many to consider seeking out viable, less expensive
alternatives to the traditional SAS, SPSS and Minitab statistical software
packages. Some of the drawbacks and limitations of replacing these packages
with Excel and its Data Analysis and Charts procedures were pointed out.
Publisher Add-On programs that overlay Excel were discussed and some of their
limitations were also noted. This paper then considered a number of free, or
low cost, alternatives including web-based software available such as StatCrunch, StatPages, and CrunchIt! Free or inexpensive downloadable pages including ActivStats 3.0, MyStat, R and Statcato were also noted. Some teaching applets developed
at Rice University were also mentioned.
StatCrunch was seen to have an extensive and
inexpensive library of programs. MyStat was seen to
be a competitor of SPSS, SAS, Minitab, JMP and other classical software
packages. Its student version is more powerful than the student versions of its
competitors and it is free! R was seen to be a free programming language for
advanced statistics use, while Statcato and ActivStat 3.0 focus on introductory level and community
college students and faculty. Whether introductory or advanced, there are many
additional links listed on pages mentioned herein for the interested statistics
reader to explore.
REFERENCES
CrunchIt!
2.0. 2010. Available: http://crunchit2.bfwpub.com/crunchit2/_flash/
Cryer, Jonathan D. 2001. Problems With
Using Microsoft Excel for Statistics. Paper presented at the Joint
Statistical Meetings, Atlanta, GA.
Heckard, Robert F. & Jessica Utts. 2010. Resources on the Web for Statistics Students
and Teachers. Davis, CA: University of California, Davis. Available: http://anson.ucdavis.edu/%7Eutts/statlinks.html
Institute for Statistics and Mathematics. 2010. Wein, Germany: WU Wien. Available: http://www.r-project.org/main/shtml
Lane, David. 2008. Rice Virtual Lab in Statistics. Houston, TX: Rice University.
Available: http://onlinestatbook.com/rvls.html
Object
Refinery Limited. 2009. Statcato. Available: http://www.statcato.org
Pearson Education. 2010.StatCrunch - Data
analysis on the web. Available: http://www.statcrunch.com
Pezzullo,
John C. 2010. StatPages:
Free Statistical Software. Available: http://statpages.org/javasta2.html
Systat. 2008.
Available: http://www.systat.com/MystatProducts.aspx
Velleman,
Paul F. 2010. ActivStats for Business Statistics. Boston: Pearson.